GE Logiq E9 2.0
Call to configure, special pricing available 317-759-9210
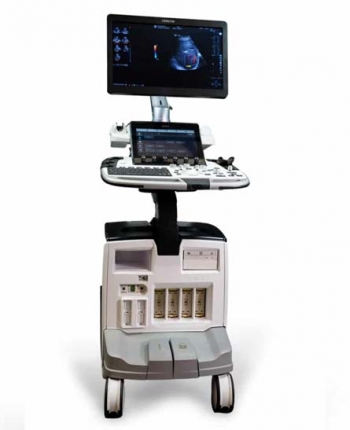
The refurbished GE Logiq E9 with XDclear 2.0 is GE’s second revision of the popular Logiq E9 premium general purpose radiology ultrasound machines. Among the more popular radiology machines, the Logiq E9 2.0 presents among the best value and cutting-edge technology in ultrasounds today. As a premium shared service ultrasound machine, the GE Logiq E9 2.0 price can vary greatly due to its various configurations. In particular, later models that include XDClear technology will be more costly, yet still very reasonable in price.
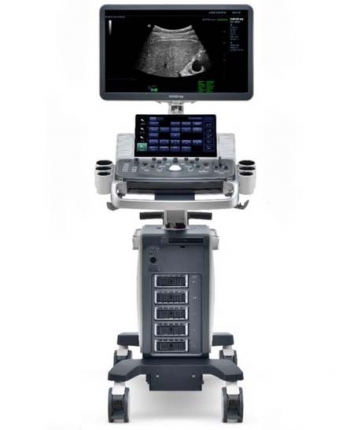
The GE Logiq E9 2.0 and its previous version, GE Logiq E9, are similar systems with each featuring its single crystal probe technology that provides outstanding image resolution. XDClear technology provides compatibility with single-crystal probes, which has a dramatic and powerful impact on image resolution. The GE Logiq E9 with XDclear 2.0 adds the transducers C2-7-D, C2-7VN-D, C3-10-D, and L3-9i-D that are improved versions of previous transducers on the Logiq E9.